Monday, November 30, 2009

GBP/USD in Asia Session

DDFX Forex Trading System in 1 hour chart

Fast Trend: Bullish

Medium Trend: Bullish

Major Trend: Bullish

Market Sentiment: Bullish

Pivot Point: Price opening upper pivot line suggesting bullish will continue

EMA 75: Bullish

Overall trend is Bullish

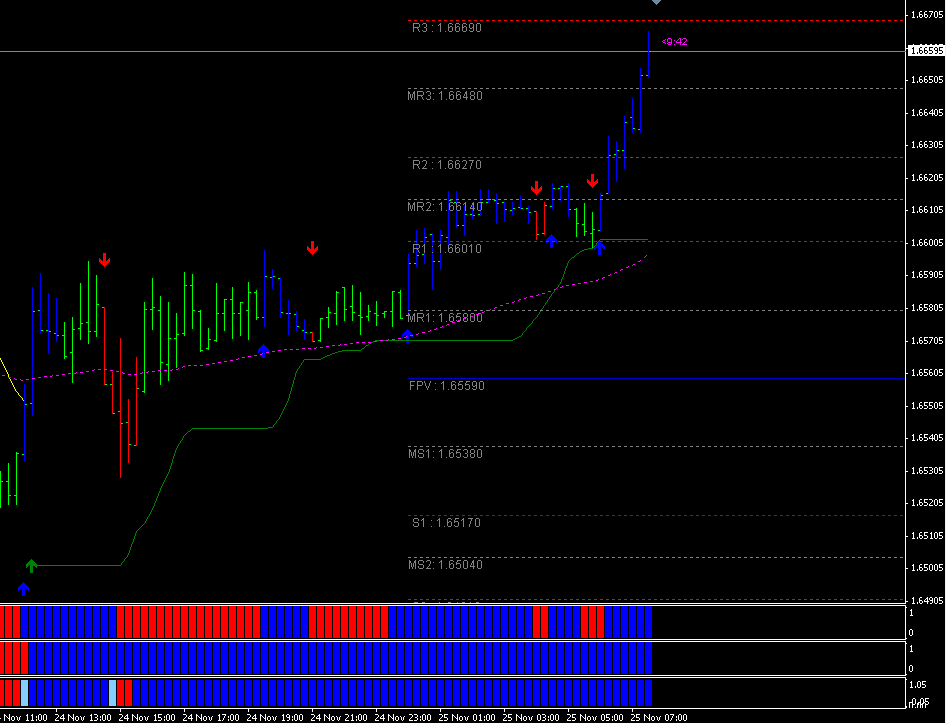
This pair now testing support at R2 (1.6576).

Below image is a price action in 15min TF.


Long Holiday

Just back from long public holiday!

Thursday, November 26, 2009

U.S. DOLLAR: WHAT THE FED EXPECTS

The price action in the currency market over the past 24 hours suggests that foreign exchange traders may have already gone into holiday mode. Intraday trading ranges are beginning to shrink and the performance of the dollar was mixed against the key currencies. For example, the dollar traded higher against the British pound and commodity currencies (AUD, NZD, CAD) but fell against the euro, Japanese Yen and Swiss Franc. Although U.S. equities ended the NY trading session in negative territory, it was off its lows. With the holiday looming in the U.S., forex traders are hesitant about taking the dollar to a fresh year to date low against the euro and Japanese Yen. However the fact that the EUR/USD remains above 1.49 and USD/JPY is trading at a one month low suggests that we could see further losses in the U.S. dollar

COURTESY FROM FX360.COM

GBP/USD 26 Nov 09 Asia Session


Fast Trend: Bullish
Medium Trend: Bullish
Major Trend: Bullish
Market Sentiment: Bullish

Pivot Point: Price opening upper pivot line suggesting bullish will continue
EMA 75: Bullish

Overall trend is Bullish

Wednesday, November 25, 2009

25 Nov 09


Our commentary also can be viewed in forexfactory.com.

Yeah! Like we mention this morning in Asia Session that this pair might turning north. Now GU Testing R3 at 1.6669


Tuesday, November 24, 2009

GBP/USD analysis on 24 Nov 09


Yesterday Daily Candlestick: Long Bull candle
Divergence: No at Daily Chart
Today Pivot: Upper Pivot line suggesting that this pair is bull.
EMA 75 at 1 hour: Bear
Breakout at 1 hour: No

GBP/USD is in bearish momentum in 1 hour chart, but is it already oversold in daily chart, suggesting that this pair may reverse.

DDFX Forex System in 1 hour chart:Mix Signal
Fast Trend: Bearish
Medium Trend: Bearish
Major Trend: Bullish
Market Sentiment: Ranging

Order Your DDFX Forex System Today at Discounted Price, the price will be up in Jan 2010.

Monday, November 23, 2009

GBP/USD is oversold!


Yesterday Daily Candlestick: Reversal may occur
Divergence: No at Daily Chart
Today Pivot: Lower Pivot line suggesting that this pair is bearish.
EMA 75 at 1 hour: Bear
Breakout at 1 hour: No

GBP/USD is in bearish momentum, but is already oversold in one hour chart suggesting that this pair may have some correction today or in ranging mode.

DDFX Forex System in 1 hour chart:
Fast Trend: Bearish
Medium Trend: Bearish
Major Trend: Bearish
Market Sentiment: Bearish


Coming back from Holiday

i take a retreat at my hometown for 4 days and stay away from computer and the net. What a good moment. Today is a new day to continue our fighting the Bull and the Bear.

cheers!

Wednesday, November 18, 2009

GBP/USD at 17 Nov Asia Session


Hanging man is around and divergences still in control.

Yesterday Daily Candlestick: Hanging Man
Divergence: Yes at Daily Chart
Today Pivot: Lower Pivot line suggesting that this pair is bearish.
EMA 75 at 1 hour: Bull
Breakout at 1 hour: No

GBP/USD still in bullish momentum, but the appearent of hanging man & divergence in daily chart chart suggested that this pair might have some correction.

DDFX Forex System in 1 hour chart:
Fast Trend: Bearish
Medium Trend: Bearish
Major Trend: Bullish
Market Sentiment: Bullish

Order Your DDFX Forex System Today at Discounted Price, the price will be up in Jan 2010.


Tuesday, November 17, 2009

GBP/USD Analysis on 17Nov

Yesterday Daily Candlestick: Normal
Divergence: Yes at Daily Chart

Today Pivot: Upper Pivot line suggesting that this pair is still bull.

EMA 75 at 1 hour: Bull

Breakout at 1 hour: Yes GBP/USD still in bullish momentum, but the appearend of shooting star and hanging man in 1hour chart suggested that this pair might have some correction.


Monday, November 16, 2009

Friday, November 13, 2009

New York opening

Will GBP/USD sustain it gain today? All will depend on the news at 8:30 a.m EST. It may reverse since this pair already peak at R3 or it may hit R4 at 1.6751. Let news make the way!

I don't trade at news time.

Asia Session


Hidden Divergence is seen in GBP/USD daily chart suggesting this pair might reverse back. It also nearly hit the oversold area at 20 (Stoch).

Yesterday candle is a spinning top, suggesting that market is indecisive.

This morning in Asia Session, this pair is top of Pivot Point also suggesting that this pair might reverse back. The next resistance is at 1.6616. The price action also breakout the major trendline.


Thursday, November 12, 2009

GBP/USD Daily Chart

Hidden Divergence seen in Daily chart. Daily chart is now testing EMA21.

GBP/USD analysis

Downside pressures and another fresh trend low has been made this morning. Daily charts are pushing lower again as well and the 21-day MA looks set to come back under threat. We have opted to lower the stop to above the rejection high at 1.6627 from overnight to reduce risk on the short trade.

GBP/USD testing the EMA75

It seem like Sterling rebound back and now testing EMA75 at 15 Min Chart.

The price action is still below Daily Pivot Line meaning that this pair is in bearish mode.

Our DDFX system in 1 hour chart still maintain to the bearish site.

We still waiting either the Price Action break the Pivot line and go higher or will wait another bearish signal in 15min chart.


Wednesday, November 11, 2009

GBP/USD Channel line Breakout

GBP has breakout it channel line and going south. Now the Sterling is testing the breakout line, if fail it will fall sharply against USD.

Sterling falls sharply after BoE's King comments

Sterling fell to session lows against the dollar and the euro on Wednesday after Bank of England governor Mervyn King said a weak pound would help the UK economy rebalance towards exports. The comments [ID:nBOE002098] came after the latest quarterly Inflation Report showed UK inflation will be below target in two years time if interest rates rise gradually from the middle of next year as financial markets expect. However overall the Monetary Policy Committee saw broadly balanced risks of inflation being above or below their 2 percent target by late 2011, suggesting little immediate need for more quantitative easing.

Courtesy of reuters.com

No valid signal

Mix Signal from my ddfx. No trade for now. Will wait until Europe open.


Tuesday, November 10, 2009

GBP/USD rebound at S2

GBP/USD rebound back at S2 (1.6599). Even though our DDFX Signal has turn to short site, it still ranging between pivot line and S2.

Paydotcom is our affiliate partner

Anyone interested to become our affiliate, please register here. Every sale, We give USD40.00

https://paydotcom.com/a.page.php?id=92422&u=anomaht

GBP/USD Consolidate around Pivot Point

GBP/USD stuck at 1.6842. Support at 1.6744 and Resistance at 1.6831.
This pair is having a retracement and our DDFX System indicated the bullish momentum is not over yet.

Will wait until Europe Session and London Session sooner.

Sunday, November 8, 2009

What should i do in the Middle of Signal

A few users asking me what should i do if i miss the first signal.

You can do a few things;

  1. Wait for the next signal that may come up after a few hour, days, or weekly.
  2. Go to lower time frame i.e 5 or 15 min and try to find the signal after the price action retrace back.

Gbp/Usd Weekly Technical Summaries.

From the image it show clearly how Price Action rebound at EMA72 after a minor decline and went up again but rejected at R1 (1.6622). It end up with 1.6610. Overall our DDFX indicator still show that the Price Action is bullish and we are looking forward to go bullish again next week. Next Resistance is at 23 Oct 2009 High at 1.6692.

Saturday, November 7, 2009

What is DDFX Forex Trading System


What Is DDFX Forex Trading System?
DDFX Forex Trading System is used by DDFX Team to Trade Forex. It consist of 9 Modified and Adapted Forex Indicators to suite our Trading Strategy and Environment.

Who is the Founder of DDFX Forex Trading System?
DDFX is created by modifiying a few existing forex indicator to suite our trading stail and enviroment by our mentor, Anomaht Aitin after more than 2 years of researching for the best tool to trade forex.

How to Use DDFX Forex Trading System?
It is very easy to used DDFX. When green and/or blue arrow appear, all 4 indicators are blue you go Long position and if the Yellow and/or red arrow appear, all 4 indicators are red you go Short position.

Can DDFX Filter the False Signal?
Yes. It can filter out the false signal (if not all).

How much pips i can gained through this Strategy?
It is depend on the Price Action it self. Min >100 pips weekly (Please refer to the top image).

Friday, November 6, 2009

GBP/USD in Asia Session

The trend is still Bullish because it still upper 200EMA. The uptrend may continue because the price action (PA) is top of Daily Pivot Line.

My DDFX Signal suggested that PA may have some correction or the trend may change.

Thursday, November 5, 2009

5 Nov DDFX Signal on GBP/USD

After a huge moving yesterday,it seem like market take a rest...

If we see closely to the chart it forming a double top and head and shoulder pattern.
If the price action break the trendline we can see the downtrend will continue.


Wednesday, November 4, 2009

latest system performance

More than 100pips for any one using DDFX FOREX TRADING SYSTEM. GREAT!

International User

Please be informed that our website for International User is www.duitdariforex.com/eng.php